Data flow diagrams (DFD) are graphical representations of the “flow” of data through an information system, modeling its process aspects. A Data Flow Diagram is often used as a preliminary step to create an overview of the system, which can later be elaborated.
A data flow diagram is a popular way to visualize the major steps and data involved in software system processes. This is not the same as business process modeling; DFDs were usually used to show data flow in computer systems, although in theory be applied to business process modeling. DFDs are useful to document the major data flow or to explore a new high-level design in terms of data flow.
Understanding the Concepts of Data Flow Diagrams
The concept of Data Flow Diagrams (abbreviated as DFDs) was introduced by De-Marco in 1978 and also by Gane and Sarnon in 1979. DFD is an important tool used by the system analyst. In simple, DFD gives an outline modeling of the system to be built and also can be designed to study the data flow of an already existing system in a graphical interface.
As an Architect who draws sketches of the house that is to be built, he does it after gathering the requirements of the house buyer and then translates it into a blueprint that gathers all engineering requirements for the house. Misinterpretation may take place when an architect talks to the house buyer about the model of a house in his words, surely the house buyer won’t understand all his ideas. Once a wise man said that people understand 100% of what they see but only 50% of what they listen to. So, to describe his model to a house buyer architect can use drawings and models.
In a similar way, a system analyst is compared to an architect and user to house buyer. A meeting between these two parties to get an output of usually two types; a business requirement outline and prototype of the way the system will function, and a schematic represented by modeling tools for programmers. This meeting can be taken as the requirement-gathering session of the System Development Life Cycle (SDLC).
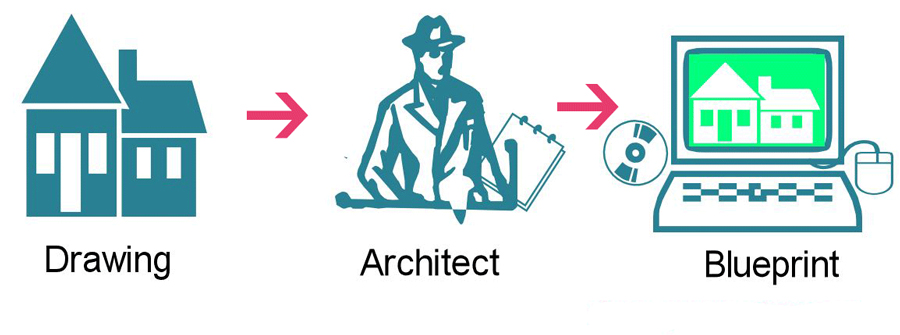
Figure 1 – The interfaces required to design and build a house
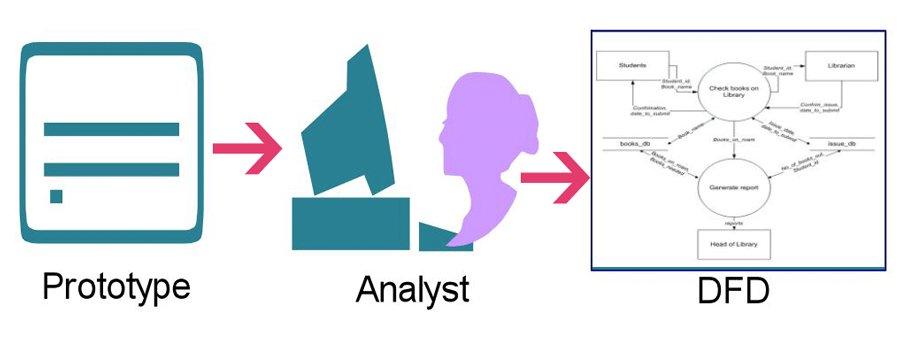
Figure 2 – The interfaces required to design and build a system
So, a DFD models a system by using external entities from which data flows to a process that transforms the data and creates output data flows which go to other processes or external entities or data stored. Similarly, stored data may also flow to processes as inputs. DFD is a perfect and simple way of modeling a system for ease of understanding and at the same time is very flexible too. Designing DFD is easy and simple because it uses only four symbols. The least number of symbols used in DFD makes it look neat and easy to understand.
Symbols used in Data Flow Diagrams (DFDs)
So far, we discussed the concept of Data Flow Diagrams, now it’s time to learn some symbols used in them. Designing a model using the concept of DFDs is an easy way because it uses not more than 4 simple notations. Using less number of notations makes it look simple and easily understandable. DFD consists of four notations for four different functions. Functions are processes, data flows (inputs or outputs), external entities, and definitely data store. So, let’s explore the symbols used in Data Flow Diagrams.
Processes in Data Flow Diagram:
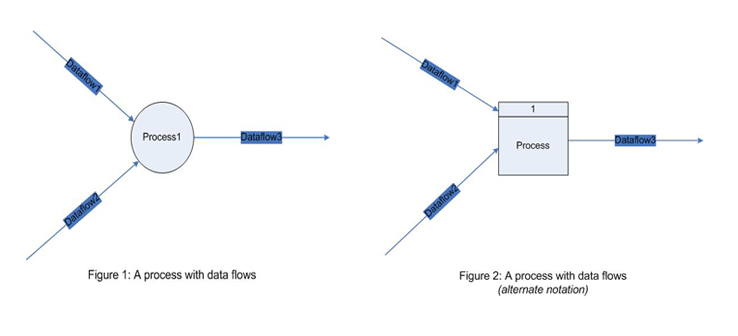
A circle is used to represent a process. Processes are directed by inputs and outputs with the notation of lines with arrowheads. Processes are named and when are in two or more numbers they are also numbered with the numbering technique. The term bubble is also sometimes used instead of a circle. Somewhere we can also use a notation for Process that is a rectangle. As these notations are not in-bounded by any universal standard so, you can find either of these two notations in the two different books you refer to.
Data flows in Data Flow Diagram:
Data flows are represented by a line with an arrowhead to show the direction of the flow of data. These data flows are labeled with the name of the data. A data flow shows both inputs and outputs. When data flow is directed to process then the data is taken as inputs and when data flow is directed to external entities or data stores then the data is taken as output. If data flow consists of arrowheads in both directions then it indicates that the data is taken as both input and output. For a symbol of data, flow refers to Figure 1-2.
External entities in Data Flow Diagram:
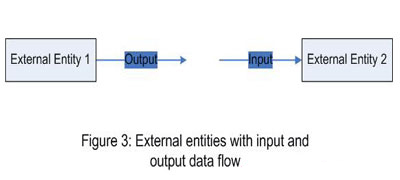
External entities are represented by rectangles. External entities can be vendors, accountants, customers, managers, and so on. Logically they are outside the system; it means the system designer has no control over them. They either supply or consume data. Entities supplying data are known as sources and those that consume data are called sinks.
Data store in Data Flow Diagram:
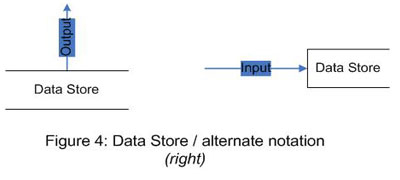
Data stores are represented by two parallel lines. Simply, they have used store data outgoing form processes. Processes can also retrieve data from the data store. The storing and retrieving of data from the data store are indicated by data flow lines and their arrowheads. If both arrows are there, it indicates that one may write in or read from the store. An alternate notation is also used for data storage (rectangle with one open breadth) as shown in the figure.
Remember:
Data flow can take place between
- two different processes
- a data store and a process
- a process and a data store
- an external entity and a process
- a process and external entities.
But data flows cannot take place between two data stores or between two external entities.
How do we begin to construct Data Flow Diagrams (DFDs)?
Before we begin, little knowledge of UML tools like Microsoft Visio, Dia, StarUML, or draw.io would be very handy.
So let’s begin with the top-down process to construct and draw DFD (data flow diagrams) in an easy way:
- Draw a bubble/circle to represent the process you are about to define.
- Ask yourself what thing(s) initiate the process: what is coming in? You will find it advantageous to be consistent in where you show process inputs. Try to model them to the left of the process. You will later be able to immediately define your process inputs when looking back at your DFD, especially when using them for system enhancements.
- Determine the process outputs, or what things are coming out, and model them to the right of the process as best you can.
- Establish all files, forms, or other components that the process needs to complete its transformation. These are usually data stores that are utilized during processing. Model these items either above or below the process.
- Name and number the process by its result. For example, if a process produces invoices, label it “Create Invoices.” If the process accomplishes more than one event, label it by using the “and” conjunction. This method will allow you to determine whether the process is a functional primitive. Ultimately, the name of the process should be one that most closely associates the DFD with what the user does. Therefore, name it what the user calls it! The number of the process simply allows the analyst to identify it to the system and most important to establish the link to its children levels during functional decomposition.
Let us now apply this procedure to the example problem domain given below.
Problem domain to construct Data Flow Diagram:
Vendors send Mary invoices for payment. Mary stamps on the invoice the date received and matches the invoice with the original purchase order request. Invoices are placed in the Accounts Payable folder. Invoices that exceed thirty days are paid by check in two-week intervals
Step 1: Draw a bubble

A process bubble used in Data Flow Diagram
Figure 1: A process bubble.
Step 2: Determine inputs
In this example, we are receiving an invoice from a Vendor. The Vendor is considered a Terminator since it is a boundary of the input and the user cannot control when and how the invoice will arrive. The invoice itself is represented as a data flow coming from the Vendor terminator into the process as shown in Figure 2:
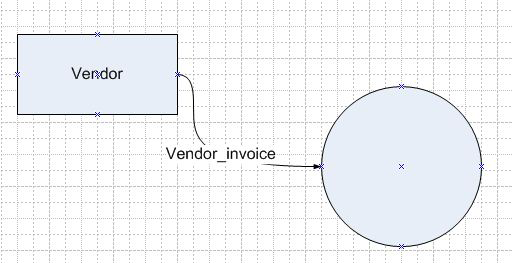
Vendor invoice (as entity) to process to DFD
Figure 2: Terminator sending an invoice to the process.
Step 3: Determine the outputs of the process
In this case, the output of the process is that the Vendor receives a check for payment as shown in Figure 3:

DFD with output to the Vendor through Process
Figure 3: DFD with an output of check sent to a vendor
Step 4: Determine items required to complete the process
In this example, the user needs to:
- match the invoice to the original purchase order;
- create a new account payable for the invoice in a file; and
- Eventually, retrieve the invoice from the Accounts Payable file for payment.
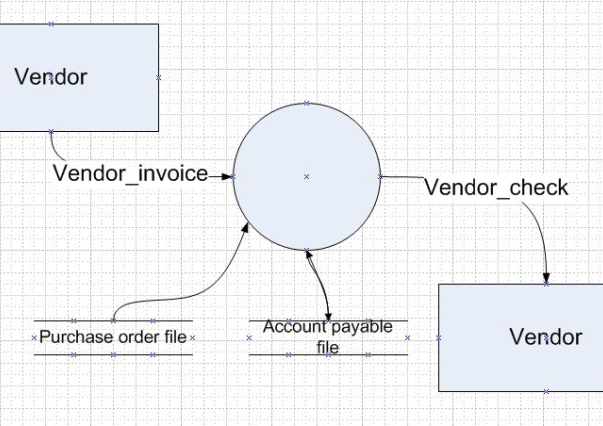
Note that in Figure 4 the Purchase Order file is accessed for input (or retrieval) and therefore is modeled with the arrow coming into the process.
The Accounts Payable file, on the other hand, shows a two-sided arrow because entries are created (inserted) and retrieved (read). In addition, arrows to and from data stores may or may not contain data flow names. For reasons that will be explained later in the chapter, the inclusion of such names is not recommended.
DFD with interfaceing data store
Figure 4: DFD with interfacing data stores.
Step 5: Give the process a Name
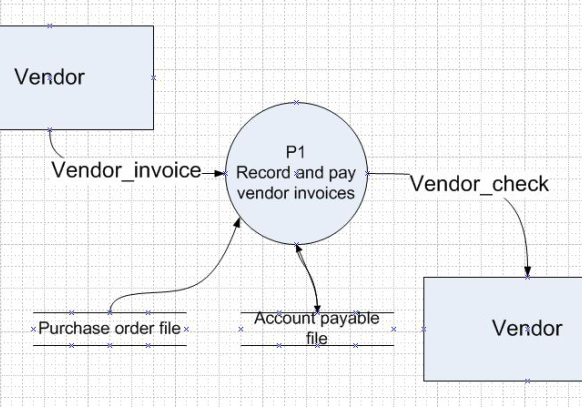
Final named DFD
Figure 5: Final named DFD.
The process in Figure 5 is now a complete DFD that describes the event of the user. You may notice that the procedures for stamping the invoice with the receipt date and the specifics of retrieving purchase orders and accounts payable information are not explained. These other components will be defined using other modeling tools. Once again, the DFD reflects only the data flow and boundary information of a process.
The DFD in Figure 5 can be leveled further to its functional primitive. The conjunction in the name of the process can sometimes help analysts to discover that there is actually more than one process within the event they are modeling.
Based on the procedure, the event really consists of two processes: Recording Vendor Invoices and Paying Vendor Invoices. Therefore, P1 can be leveled as shown in Figure 6.
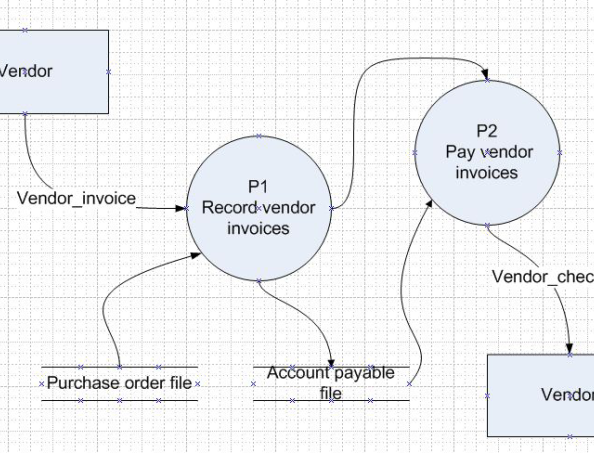
Leveled DFD for Record and Pay Invoices process
Figure 6: Leveled DFD for Record and Pay Invoices process.
So, by this time I hope you are able to design DFD by using symbols used in DFD
Pingback: Mastering Concepts of Database and Database Terminologies